Snapshots
Snapshotting is the process of writing data to a database on a regular schedule. With Digifi’s self-service data prep, this equips a business analyst to easily create a historical data mart for tracking changes, isolating patterns, and forecasting outcomes with time series analysis. This results in improved foresight and faster decision cycles.
How it Works
Digifi considers every file a snapshot (even if it is just a onetime load) and will add four additional columns to your data file at load time:
a datetime representing when the row was added to the database table.
The first three columns (row_id, latest, data_date) are indexed for fast query execution. The `date_time` column is mainly used for administrative tasks and is rarely, if ever, used within an analysis.
Snapshot Query Suggestions
Latest
As you write queries, get in the habit of always adding the following filter:
This will ensure you are working with the most recent data and will prevent you from selecting an entire database into your analysis.
Patterns
Snapshotting data will result in unique patterns. Use the GROUP_CONCAT function to isolate the patterns over your time interval. For example, we can examine sales opportunity stage progressions this way by group concatenating stage ordered by the weekly snapshot date:
If we apply this logic to our opportunities and find that the most likely pattern is:
we know that our sales people are either handling transactions or not using the CRM tool to record each stage in the sales cycle according to the expected process:
Trends
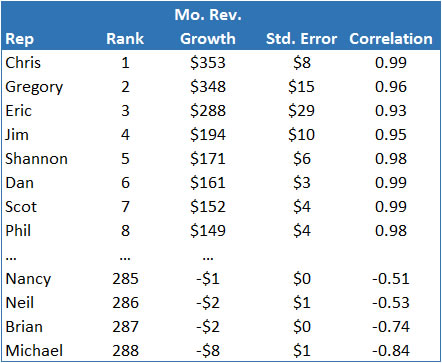
In-database analytic procedures allow you to examine linear trends in your data using the SLOPE and CORRELATION functions. For example, we may want to identify which sales reps are showing steady revenue growth over time. We can describe individual trends with the following functions:
From our results we can quickly report on which reps are reliably growing revenue and which are not:
Historical Attributes
One of the most common errors in predictive modeling is to use current data as a surrogate for historical data. For example, we may use company demographics from the most recent quarter to describe a target outcome that happened eight quarters ago. This causes a significant bias in the analysis because current demographics are usually dependent on the target outcome under study. The result is knowledge or prediction that does not generalize to future events (a real downer for predictive deployments).
Snapshots provide an easy way for building a data set with date-specific attributes. Contact information (address, phone, title), for example, may need to be from the most recent snapshot, while attributes describing a historical outcome would share the same date period with the outcome event. We can do this by joining to the main reference table in a nested select attribute:
This logic would give us the original product list from January 2, 2015 while our main from clause:
would supply information from the most recent snapshot.


